01
What will unmanaged EV charging cost?
Estimate added coincident peak demand charges and compare them with the co-op margin from increased energy sales.
GIM connects forecast EV loads, G&T demand charges, distribution co-op margins, participation and program costs to a complete capital-compatible business case—not just a general estimate of avoided peak demand.
Breakeven enrollment matters, but a defensible business case must also show the cost of doing nothing, the cost and performance of the program, and the financial effect across the entire service area.
Estimate added coincident peak demand charges and compare them with the co-op margin from increased energy sales.
Quantify peak kW shifted, remaining peak exposure, avoided G&T charges and changes in the energy margin.
Separate platform, communications, hardware, administration, acquisition, marketing and customer incentives.
Calculate levelized annual cost, benefit-cost ratio, payback, NPV, annual cash flow and customer-level metrics.
Enter G&T peak charges, energy margins, technology costs and incentives.
Use forecast EV ownership, coincident kW, participation and engagement.
Calculate avoided demand charges, revenue margins and operating costs.
Levelize capital costs and calculate payback, B/C ratio, NPV and cash flow.
Include participating and nonparticipating EVs across the service area.
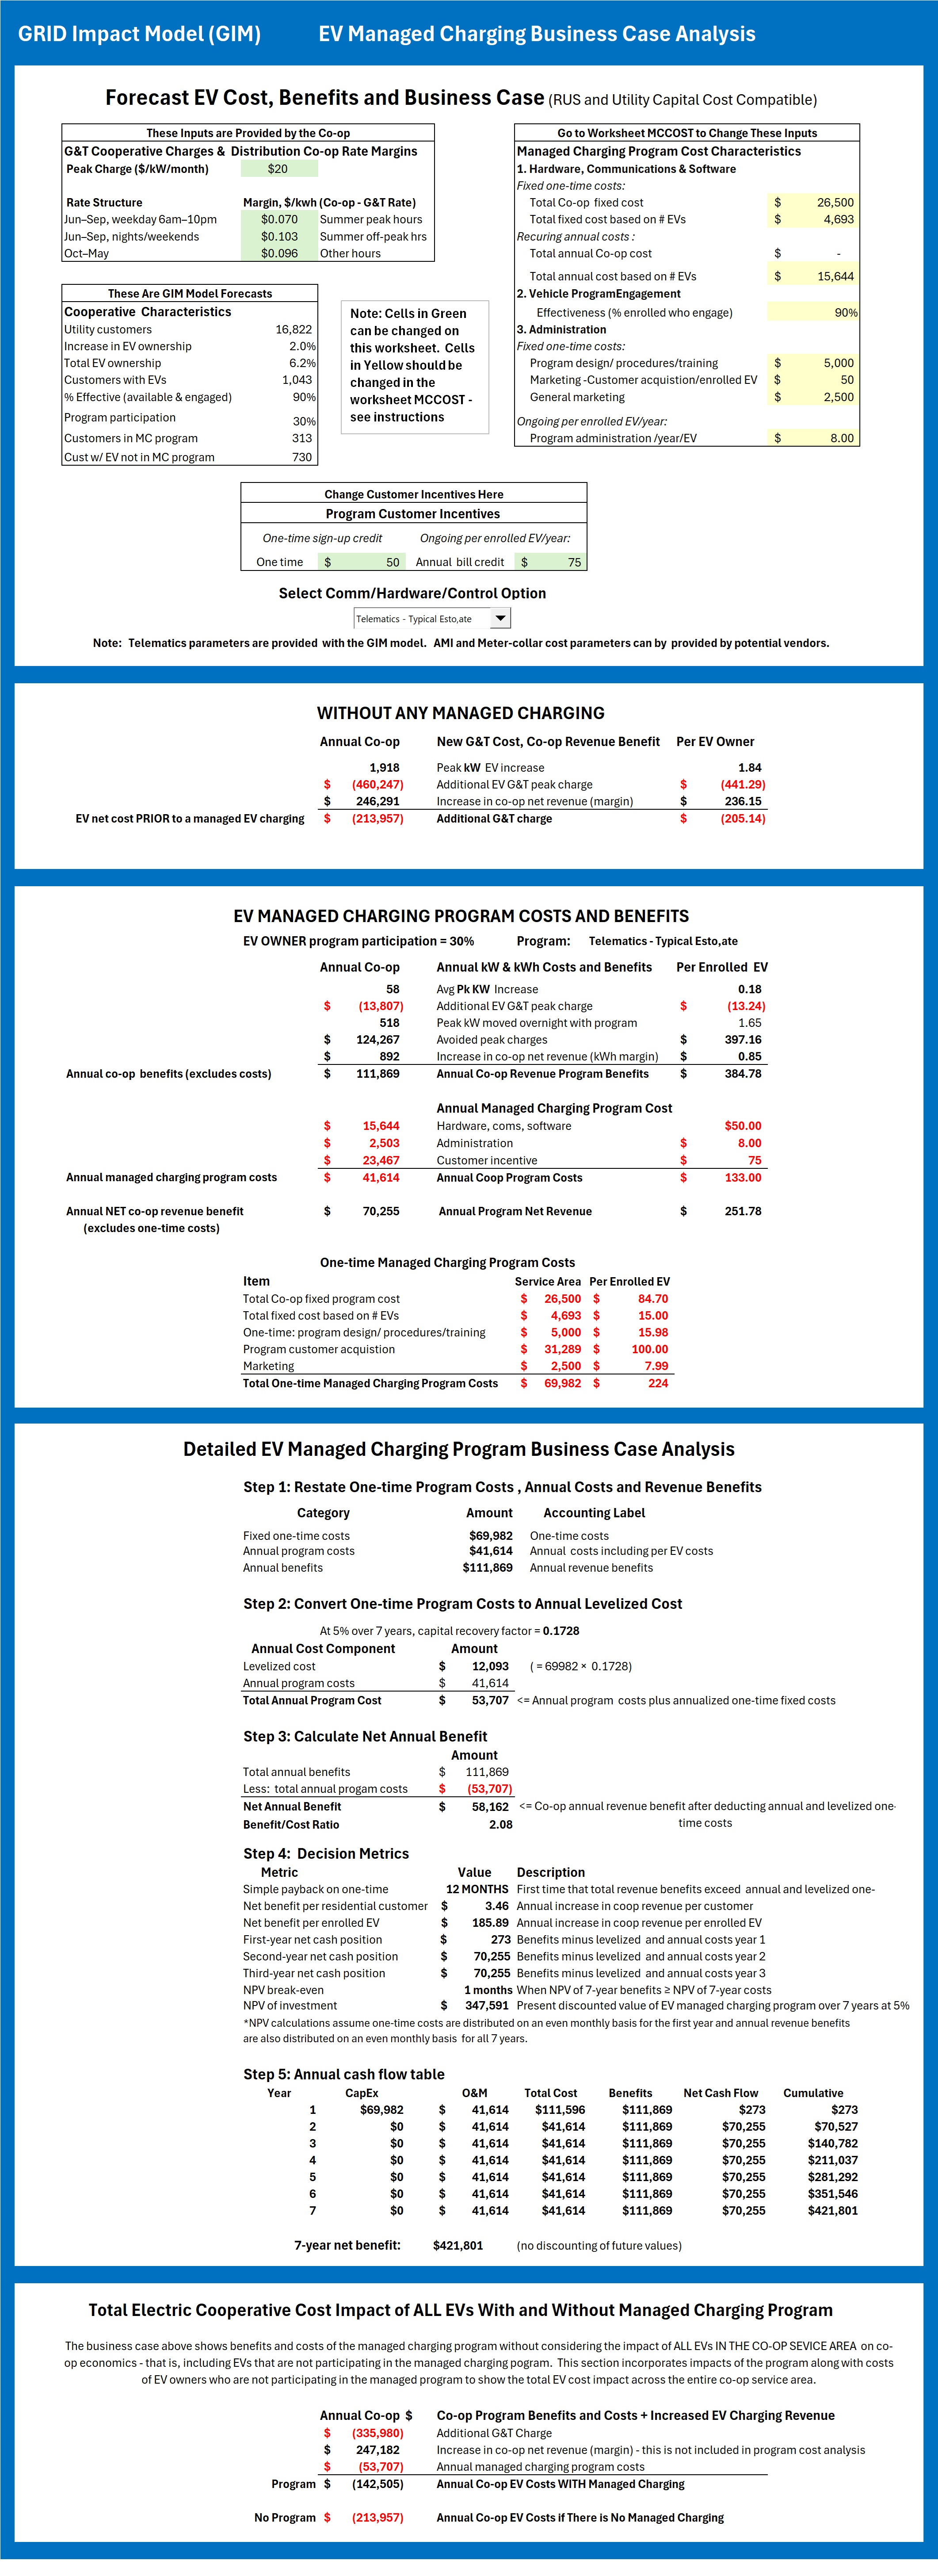
The current GIM worksheet brings the complete analysis together. Green cells are co-op inputs, yellow cells are managed in the MCCOST worksheet, and GIM supplies the underlying EV and hourly-load forecasts.
 Open the complete full-size worksheet screenshot ↗
The result is only as credible as the assumptions. GIM keeps the most important drivers visible so users can test vendor quotes, alternative incentives and conservative participation cases.
Reflect the co-op’s actual wholesale and retail economics.
Connect the financial case to localized customer and hourly-load forecasts.
Compare program delivery approaches instead of assuming one universal cost.
Distinguish enrollment from vehicles actually available and responding.
Include the costs that are often omitted from simplified avoided-cost estimates.
Test the cost of enrollment and retention strategies directly.
The example shows why new EV energy sales do not automatically create a positive co-op result. Added G&T peak charges can exceed the new distribution margin unless charging is shifted.
All forecast EVs contribute to service-area economics without an active charging-control program.
The program example enrolls 313 EVs, assumes 90% effectiveness and shifts forecast peak charging overnight.
The worksheet separates one-time and recurring costs, applies a consistent capital-recovery treatment and presents results that management can evaluate.
Separate fixed one-time costs, annual program costs and annual revenue benefits.
Apply the selected discount rate and analysis life to convert startup costs to annual equivalents.
Subtract annual program and levelized fixed costs from annual benefits.
Report payback, benefit-cost ratio, per-customer benefit, per-EV benefit and NPV.
Show CapEx, O&M, benefits, net cash flow and cumulative results for each year.
A program-only business case can look favorable while ignoring the continuing costs created by EV owners who do not enroll. GIM therefore calculates the total co-op EV impact across the service area, incorporating program benefits and costs, new charging revenue and the G&T charges associated with both participating and nonparticipating EVs.
In the example, managed charging does not eliminate the co-op’s total EV cost because 730 EV owners remain outside the program. It does, however, reduce the annual cost materially.
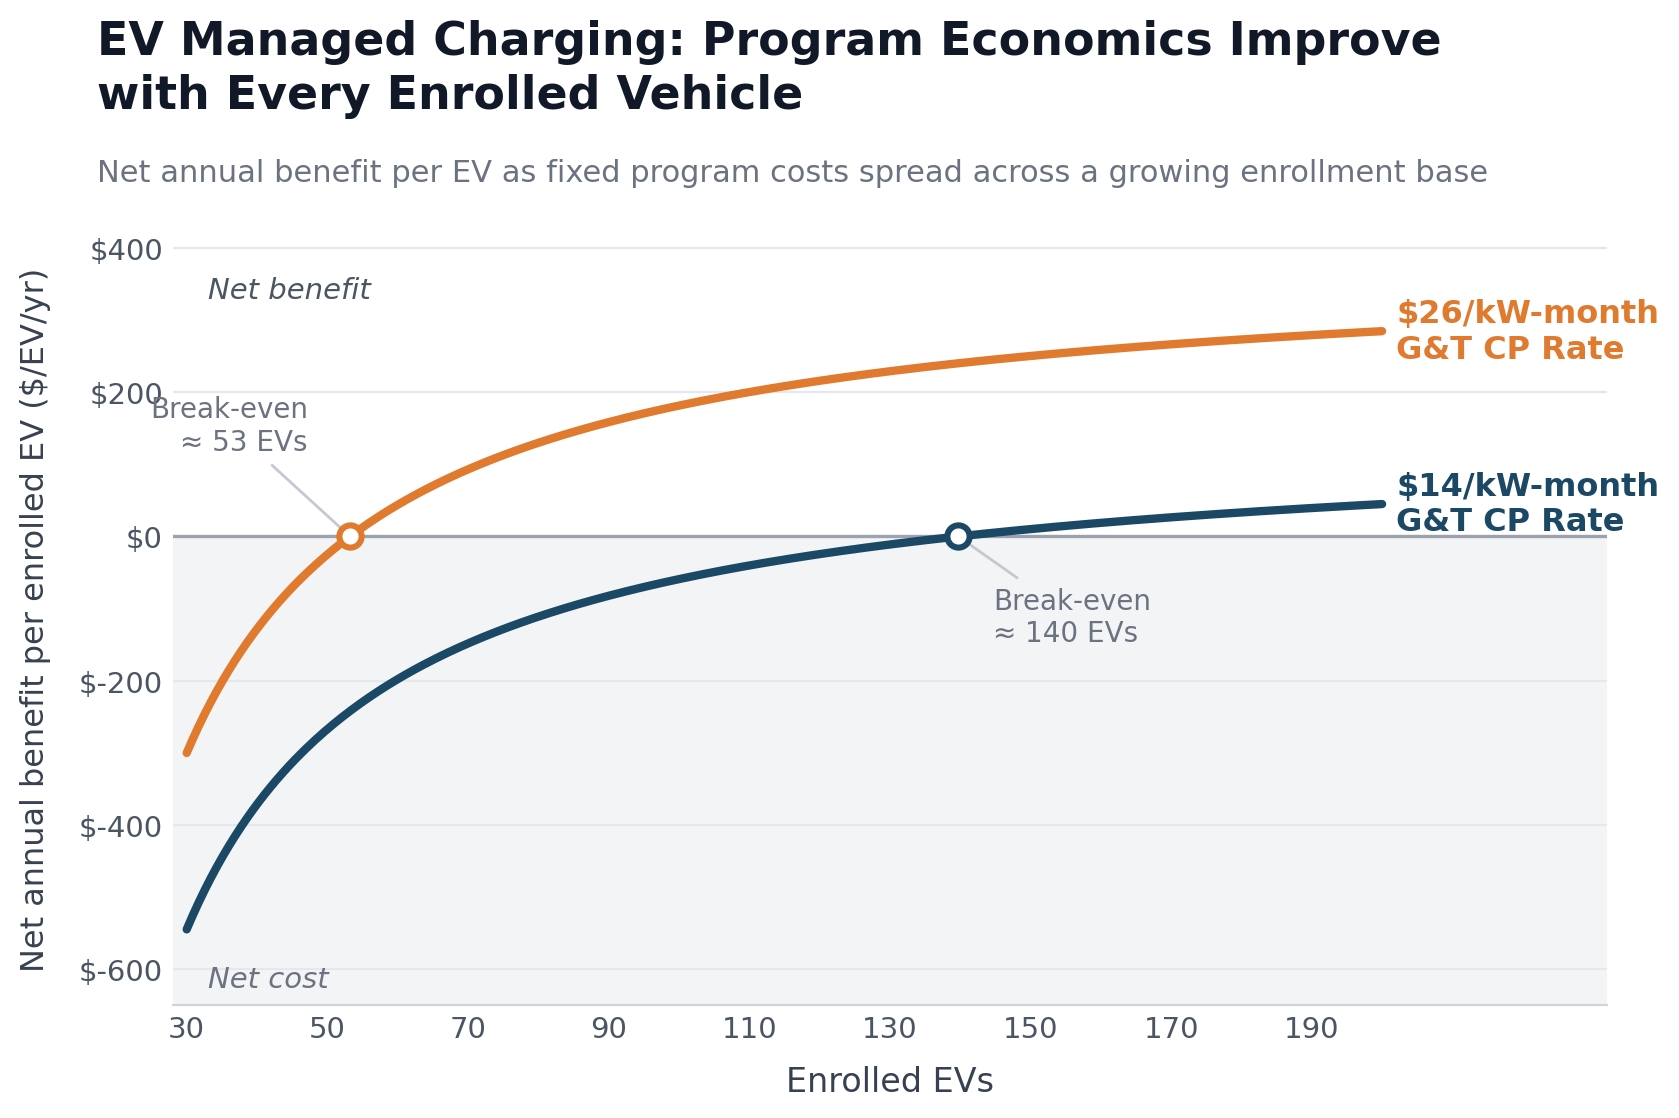
The original analysis remains useful as a sensitivity test. It shows how fixed platform costs are spread across enrollment and why the G&T coincident-demand charge is a primary determinant of the breakeven point.
The important change is context: breakeven enrollment is now one output within the broader GIM business case—not the entire analysis.
 Open the original breakeven chart full size ↗
The G&T coincident-demand charge is often the strongest benefit driver, but credible results also require the unmanaged coincident EV load, control effectiveness, participation, energy margin and complete program costs.
The program analysis measures the value created by enrolled EVs. The total-impact analysis also includes nonparticipants, whose unmanaged charging can continue to increase G&T and distribution costs.
Yes. Telematics parameters are supplied as defaults, while AMI and meter-collar alternatives can be evaluated using current utility and vendor cost inputs.
Levelization converts startup and fixed costs into a comparable annual cost using the selected discount rate and analysis period, supporting benefit-cost and capital-planning decisions.
No. They illustrate the worksheet using one set of rates, forecasts and cost assumptions. Each co-op should use its own tariff, margins, participation expectations and vendor estimates.
The managed-charging business case focuses on G&T and program economics. GIM’s distribution grid stress analysis separately screens localized transformer and feeder exposure, which may add further value to managed charging.
Request a guided demonstration of inputs, technology alternatives, cash flow, decision metrics and total service-area EV impacts.