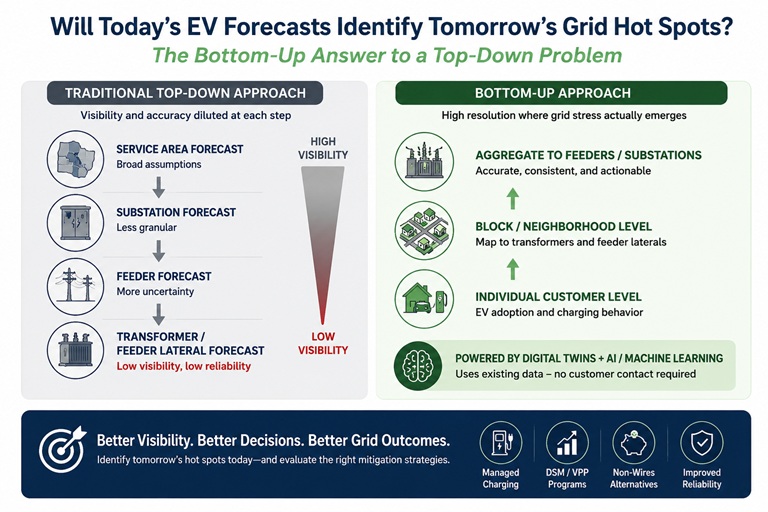
Method-by-method comparison
What changes when forecasting starts with customers
The difference is not simply more rows of data. It is the ability to preserve adoption drivers and charging behavior before results are aggregated.
Planning dimension
Top-down allocation
Customer digital twins
Starting point
Regional or service-area EV total
Actual households and individual EV probabilities
Service-area EV total
Forecast directly
Scenario target applied through household probabilities
Geographic allocation
Customer counts, load shares or broad segments
Household and neighborhood characteristics
Adoption clustering
Added through assumptions or external allocation
Emerges from differences among customers
Charging loads
Average load shape applied to groups
Customer charging added to existing whole-home loads
Time resolution
Annual, seasonal or selected peak hours
8,760 hourly results by customer and geography
Customer filtering
Limited after aggregation
Income, education, dwelling, construction year and other filters
Managed charging
Average program impact assumption
Participation, availability, control and hourly shifting scenarios
Best fit
Policy, energy and broad system planning
Localized screening, program targeting and engineering-load development