MAISY® Utility Customer Databases, Forecasting & Analysis Models
MAISY® Database and Grid Impact Model Summary
MAISY® Databases and the Grid Impact Model provide customer-level hourly load intelligence for utilities and energy technology companies to evaluate future EV adoption, electrification, DSM/DER/VPP strategies, and localized distribution-grid risk.
MAISY® Utility Customer Energy Use and Hourly Loads Databases (Market Analysis and Information System)
- Actual identity-protected data for 7+ million individual US utility customers
- Income, demographics, dwelling unit, appliance data,commuting data, locational data (block, ZIP code)
- Whole buidling and end-use electricity use and 8760 hourly loads
- Applications: utility load analysis, equipment manufacturer equipment design and market analysis, and Grid Impact Model inputs
The Grid Impact Model is a utility planning platform that forecasts localized EV adoption and charging impacts, evaluates managed EV charging strategies, and supports distribution planning and utility investment decisions.
- Forecasts localized EV adoption, charging loads, and weather-sensitive hourly demand using bottom-up customer-level load modeling.
- Identifies neighborhoods, block groups, feeders, and transformers where future EV growth is expected to create localized distribution planning challenges.
- Evaluates managed EV charging technologies, customer participation, G&T coincident peak demand reduction, and utility financial and business case analysis.
- Supports distribution planning with localized hourly load forecasts that can be exported to CYME, Synergi, WindMil, OpenDSS, GIS, and other engineering tools.
- Compares managed and unmanaged charging scenarios to support capital planning, non-wires alternatives, and board investment decisions.
- No AMI data or customer contact is required; the model uses identity-protected MAISY customer databases and publicly available demographic and housing information.
MAISY® Utility Customer Hourly Load Data for Electric Utilities and Energy Technology Companies

-
- Socio-economic, dwelling unit, appliance, commuting data, location (block, ZIP, service area) for 7+ million actual, individual identity-protected utility customers.
- Customer end-use energy use and 8,760 hourly load data for each individual customer.
- Provides enhanced grid visibility including EV and weather impact analysis, customer growth/dwelling unit churn, smart technology design, DSM technology and program analysis and targeted DER deployment.
- Supporting more than 150 market analysis, forecasting, technology analysis, hourly load analysis projects for electric utilites, federal and state governments, private company clients.
Unlike engineering-based static datasets available from EIA and NREL, MAISY® captures localized, dynamic, hourly energy use reflecting dwelling unit, appliances, demographics, and weather for 7+ million actual U.S. households. See MAISY and NREL hourly load database comparison for an objective summary of important differences in source data, scale, processing requirements, and application fit.
Other Database ItemsSummary of all MAISY DatabasesSample database applicationsApplications by industry/technologyAnalysis and consulting projects
Grid Impact Model for Managed EV Charging, Localized EV Load Forecasting, and Distribution Planning
Electric utilities need to know where EV adoption is likely to occur, how it will affect localized distribution loading, which managed charging approach offers the best value, and whether the resulting program will produce a positive financial return.
What the Grid Impact Model Does
GIM is an Excel-based utility planning platform that combines identity-protected customer databases, demographic information, transportation data, housing characteristics, and AI-assisted analytics to forecast localized EV adoption, charging loads, distribution impacts, and managed EV charging program performance.
- Forecasts localized EV adoption and 8,760 hourly charging loads by neighborhood, block group, ZIP Code, feeder, and service territory.
- Identifies where future EV growth is expected to create localized transformer, feeder, and distribution planning challenges.
- Compares managed EV charging technologies, implementation costs, customer participation levels, and operational capabilities.
- Quantifies reductions in G&T coincident peak demand charges, incremental EV electricity sales, and overall utility financial performance.
- Generates localized hourly load forecasts for engineering studies and export to CYME, Synergi, WindMil, OpenDSS, GIS, and other planning tools.
Customer-Level Forecasting Without Customer Identifiers
GIM forecasts future EV ownership probabilistically at the individual household level using AI-assisted modeling based on household income, education, dwelling characteristics, commuting patterns, vehicle ownership, and other demographic variables. The resulting forecasts naturally produce geographically clustered EV adoption patterns and localized charging behavior consistent with observations from advanced EV markets.
The model uses identity-protected MAISY residential customer databases enhanced through AI-assisted integration of more than a dozen supporting datasets, including detailed end-use metered load profiles. No AMI data, customer identities, personally identifiable information, or customer contact are required to implement the model.
Planning Future EV Growth
GIM supports current-year and future-year planning scenarios by incorporating projected EV adoption, housing growth, demolitions, rebuilding activity, demographic change, weather conditions, and managed charging participation. Utilities can compare unmanaged and managed charging scenarios to evaluate future distribution impacts, infrastructure requirements, and financial performance before major investments are made.
How Utilities Use GIM Results
Interactive dashboards and filtering tools allow utilities to evaluate results for individual neighborhoods, customer segments, feeders, ZIP Codes, block groups, and service territories. Forecasts can be summarized for executives or exported as detailed hourly load profiles for engineering analysis.
Utilities use GIM to identify future EV growth hotspots, prioritize transformer and feeder evaluations, compare managed charging alternatives, estimate avoided G&T demand costs, support capital budgeting, and provide planning information for board presentations. For utilities with detailed circuit models, GIM serves as an analytics-driven front end that identifies the highest-priority locations and scenarios before detailed engineering studies begin.
Forecast Outputs
- Localized 8,760 hourly electricity loads by customer, neighborhood, block group, ZIP Code, feeder, and service territory
- Forecast EV ownership, charging behavior, and hourly EV load impacts
- Managed EV charging technology comparisons, customer participation, and operational scenarios
- Projected transformer, feeder, and neighborhood distribution planning impacts
- G&T coincident peak demand reductions, incremental EV electricity sales, and utility financial performance
- Engineering-ready hourly load profiles for CYME, Synergi, WindMil, OpenDSS, GIS, and other planning applications
Quick Intro: Video, Online Viewer, Guided Demo
-
 1-minute Executive Overview Video
-
 5-minute online EV load forecasting viewer or EV impact analysis PDF presentation of an example EV impact analysis
-
 Grid Impact Model Distribution Planning Resources
Bottom-Up Utility Planning Workflow
This simplified workflow shows how GIM connects customer-level hourly loads to practical utility planning decisions.
The Grid Impact Model is the third generation Jackson Associates energy forecasting and analysis model. The Smart Grid Investment Model was developed and implemented for two dozen electric utilities to provide business case analysis of AMI and related smart grid investments while CEDMS and REDMS agent-based models have provided end-use electricity use and DSM analysis for more than forty electric utility, power pool, state, and federal government clients.
...Grid Impact Model (GIM)
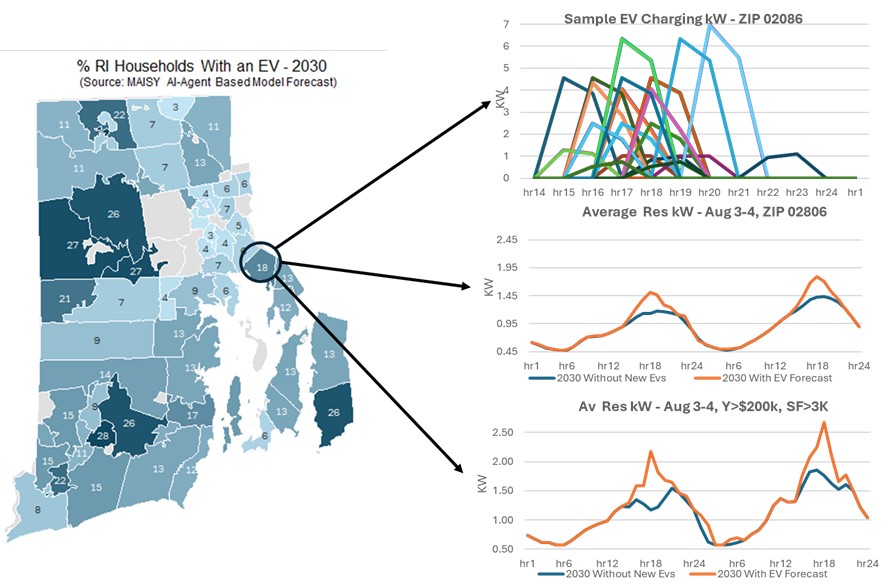
A critical new imperative for many utilities is forecasting the upsurge in small-area grid loads caused by rapidly growing EV ownership, electrification and weather extremes. Unanticipated grid overloading can cause low voltage, flickering lights, reduced transformer lifetimes and even blown transformers, not to mention customer complaints/ dissatisfaction.
Forecasting these neighborhood-level loads requires an entirely new set of tools. Digital twin modeling, a new forecasting technology that is increasingly being used to model and analyze electric utility distribution equipment, can be applied to model individual utility customer hourly loads providing new insights into small area grid threats.
Customer (as opposed to asset) digital twin modeling applies information on actual anonymous utility customers to identify likely changes in distribution grid loads and results of load-shifting utility programs. While customer records reflect real utility customers, no identities or personally identifiable information are used or available, and no customer contact is required to implement the model for utilities. Models are updated periodically to refine customer ownership, loads and utility program model relationships based on actual household information.
MAISY Energy Use and Hourly Load Residential Databases, consisting of more than 7+ million actual individual utility customers across the US, provide the perfect foundation for customer digital twin modeling. Information for each customer includes hourly electricity use by end-use (space heating, water heating, etc.), dwelling unit data, EV ownership, commuting schedules, income, and a variety of other socio-economic variables.
The Grid Impact Model (GIM) extracts utility customer records for customers residing in a specific block area for its digital twins. Changes in customer loads resulting from increased EV ownership, increased electric appliances, weather extremes, population growth, dwelling unit demolition/rebuilds, price and utility programs are forecast to determine impacts on local area transformers and feeders.
The digital twins customers reflect a statistically valid sample of actual utility customers within each block group, providing a low-cost alternative to collecting information on every customer in the service area.
Regardless of the extent of existing utility feeder and transformer power-flow modeling resources, the Grid Impact Model provides vital intelligence needed to understand future, localized grid impacts.
For utilities without circuit models, GIM delivers rapid block-level impact assessment and non-wires alternative (NWA) screening providing exportable hourly load profiles for future engineering use.
For utilities with circuit models, GIM acts as a pre-populated, analytics front end that identifies priority locations and delivers baseline and scenario-driven 8760 hourly load shapes for more timely, accurate and efficient engineering studies.
GIM modeling and analysis ensures that any utility can more effectively analyze emerging grid risks and evaluate potential solutions quickly and consistently.
Grid Impact Models Page
MAISY Energy and Load Forecasting Models

MAISY energy models and forecasts
have powered energy applications
for decades. MAISY
clients
include fortune 100 companies, start-ups, electric utilities,
US, state energy agencies and more.
MAISY AI agent-based models
provide
forecasts and
analysis
for geographic areas ranging from ZIP codes to utility
service areas to states. Model output can also provide detailed household record data for
users who want to drill down on specific issues.
- MAISY AI agent-based model methology
- EV ZIP/census tract saturation forecasts , household hourly loads W/WO EV charging
- Smart grid, solar, battery storage, DER market analysis and peak hour impacts
- Microgrid design and assessments
- Residential household forecasts including household income, demographics, dwelling unit, appliance, energy use, and hourly loads data for 6+ million US households
- Dwelling unit data, e.g., square feet, space heating equipment, appliances, etc.
- Location data: ZIP code, county, place, metro area, 30-year degree days
- Emissions data: Total, electricity, natural gas, fuel oil, propane
- Annual Energy Use by fuel type (electricity, natural gas, fuel oil, propane) and end use.
- 8760 and 15-minute kW loads (whole building and end-use, including EVs, monthly averages)
Developed by Jackson Associates
MAISY databases and forecasting models are developed by Jackson Associates, an energy data, forecasting, and analysis firm with more than 40 years of utility modeling experience and work supporting more than 150 clients. MAISY utility customer databases have been used for electric utility planning, regulatory analysis, energy technology assessment, market analysis, and customer-level hourly load forecasting.
Jackson Associates Provides Industry-Leading Data, Models and Analysis
 Why trust Jackson Associates (JA) to help with your forecasting, analysis and
data needs?
- Consider the following:
Why trust Jackson Associates (JA) to help with your forecasting, analysis and
data needs?
- Consider the following:
- We provide decision-makers with information that has informed multi-million-dollar investment decisions for some of the largest US corporations.
- Our energy, hourly load data, and forecasts/analysis results and our expert witness testimony have supported electric utility and regulatory agency investment decisions in dozens of states.
-
MAISY data have provided the information basis for development of several US Department of Energy
energy efficiency standards.
- We were among the first to apply AI machine learning to integrate and validate disparate data sources.
- Our patented business intelligence (BI) drill-down software (US Patent 5,894,311, Computer-Based Visual Data Evaluation) has been licensed by every major BI software company including Microsoft, SAP, Oracle, and others.
Frequently Asked Questions About Utility Load Forecasting and Grid Impact Modeling
What is EV load forecasting for utilities?
EV load forecasting estimates where, when, and how much electric vehicle charging load will appear on a utility system. For distribution planning, the critical issue is not just total EV energy use, but localized hourly charging impacts by neighborhood, block group, feeder, transformer, ZIP code, and customer segment.
How does the Grid Impact Model differ from traditional load forecasts?
Traditional forecasts often start with system-level growth assumptions and allocate load downward. GIM starts from identity-protected customer records, building, appliance characteristics, demographics, end-use loads, EV adoption probabilities, and small-area geography to create bottom-up 8,760 hourly load forecasts.
Can utilities analyze distribution grid stress without AMI data?
Yes. AMI data can be useful, but it is not required for GIM implementation. The model uses curated customer records and supporting datasets to estimate representative customer-level hourly loads and then evaluates future EV, electrification, weather, and DSM/VPP scenarios.
How are non-wires alternatives evaluated?
GIM evaluates how managed EV charging, DSM, DER, home battery storage, and VPP participation can reduce localized peaks or shift loads away from constrained hours. Those impacts can be compared with conventional grid investments to screen potential non-wires alternatives before detailed engineering studies.
What geographic detail does GIM provide?
GIM can produce results at the individual representative customer, block group, ZIP code, and service-area levels. Utilities can use those outputs to identify localized risks and to create inputs for feeder, transformer, or power-flow studies where those engineering models are available.
What scenarios can the Grid Impact Model evaluate?
Typical scenarios include baseline load growth, EV adoption, managed EV charging, electrification, extreme weather, housing growth, demolitions and rebuilds, DSM program participation, DER deployment, home battery storage, and VPP dispatch strategies.
Sample MAISY Clients