| State Energy Cost Increases, 2020-2022 |
New Hampshire is the Bigest Energy Inflation Loser from 2020 - 2022
ME, VT, CT, MA, RI, NY, NJ CA and IL Round Out the Top Ten Hardest Hit States.
Jerry Jackson, Ph.D., February 16, 2023

 Follow @maisyenergydata
 Summary
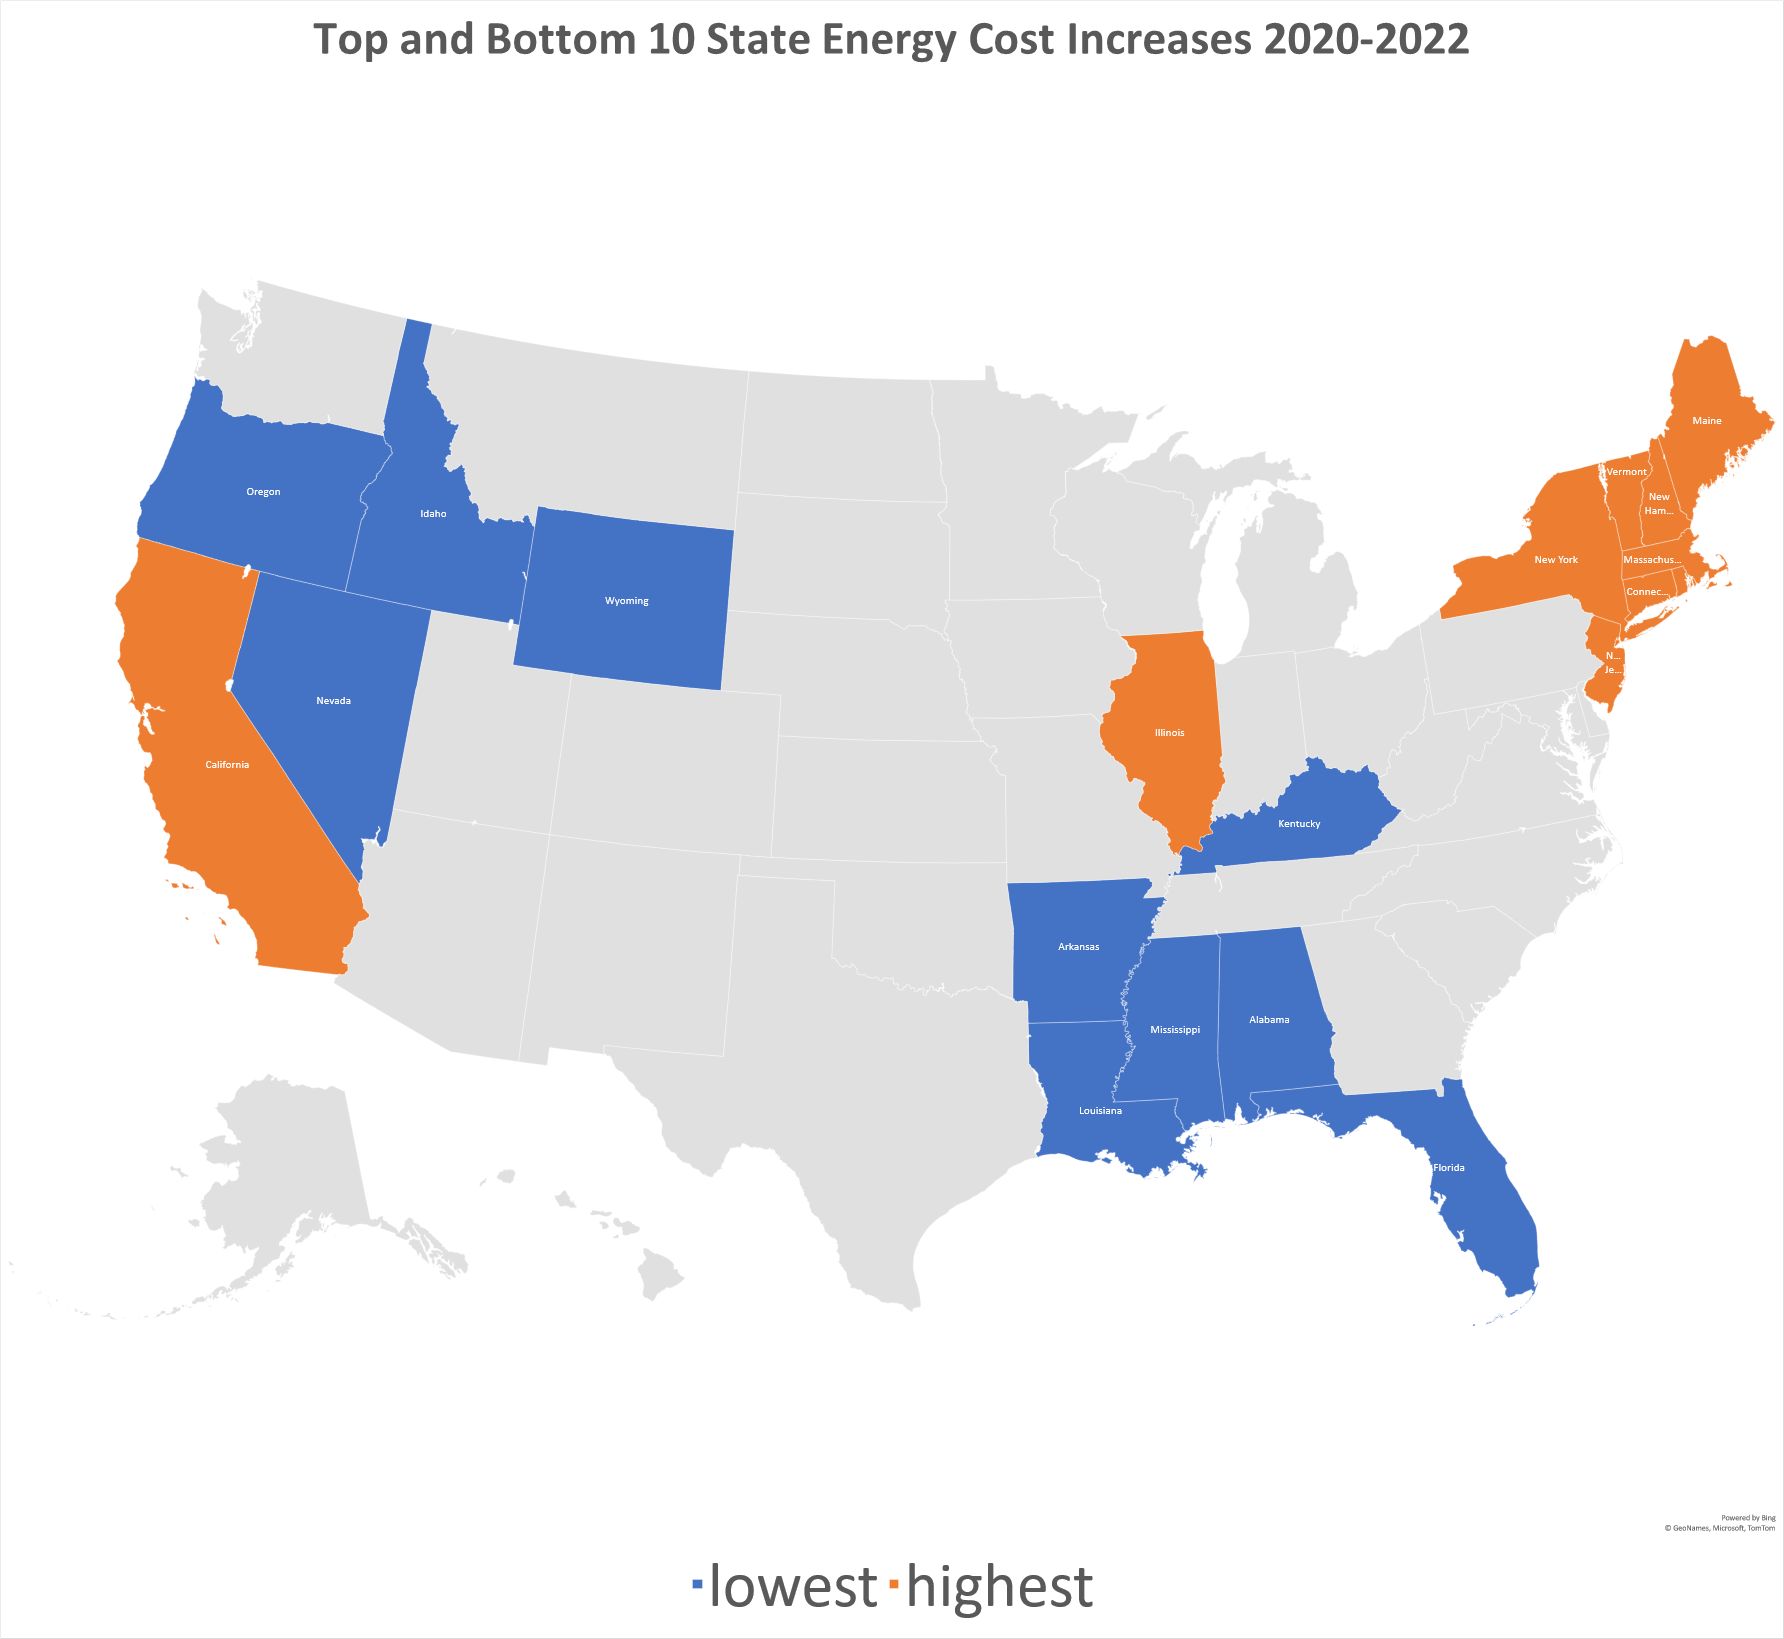
It’s final: New Hampshire led the nation in 2020 – 2022 homeowner dwelling unit and commuting energy cost increases with a whopping $2,682 increase bringing the average granite state’s homeowner energy cost to $7,254 or $606 per month, up 59 % since 2020. The greatest energy inflation pain is concentrated in eight northeastern states with California and Illinois rounding out the worst ten with 2020 – 2022 cost increases ranging from $1,863 to $2,682. Ten states with the lowest dwelling/commuting energy cost increases range from $623 to $1199 and include six southern states and four states from the west. 2020- 2022 energy cost inflation is calculated using a stratified random sample of owner-occupied households across the US drawn from 7+ million household records included in the MAISY Residential Utility Customer Energy Use Database. This “cost increase” data considers both energy use and energy price increases. For example, variations in gasoline cost reflect both homeowner commuting distance and the increase in gasoline price. Similarly, variations in dwelling unit energy costs reflect both use and energy price increases. The variation in energy cost increases across states is striking. New Hampshire homeowner energy costs have risen $2,682 compared to a $623 cost increase in Arkansas. New Hampshire's commuting gasoline cost inflation ranks number 1 at $1,446/year with dwelling unit energy costs increases of $1,236 for a number 4 ranking. The greatest energy inflation pain is concentrated in eight northeastern states with California and Illinois rounding out the worst ten with annual 2020 – 2022 cost increases ranging from $1,863 to $2,682. Ten states with the lowest dwelling/commuting energy cost increases range from $623 to $1199 and include six southern states and four states from the west. Ranking of State Average Dwelling Unit and Commuting Energy Costs and 2020 - 2022 Cost Increases Details for all states, except Hawaii are provided in this table. Numbers in parentheses for total energy reflect the percent increase from 2020 to the end of 2022 while all other parenthetical number reflect state rankings for those individual items. (Hawaii is excluded from this analysis because of its unique energy situation). 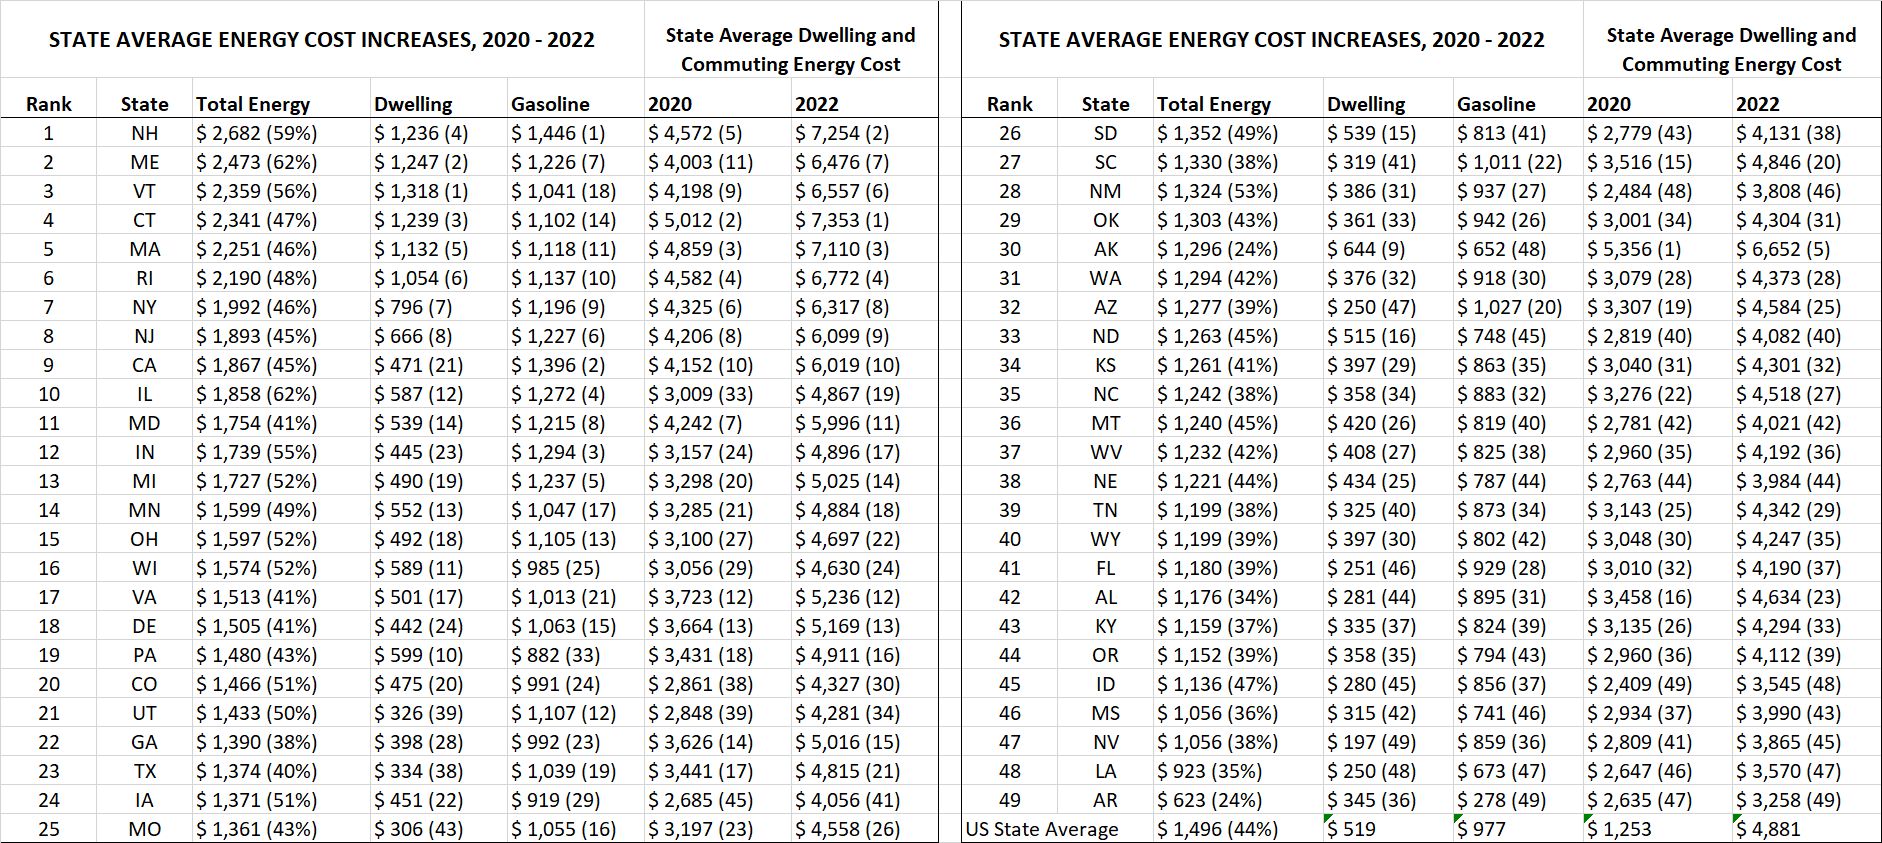
About the Data. State Energy cost inflation data are calculated using a statisitically representative sample of owner-occupied dwelling units within each of approximately 28,000 ZIP code area in each state drawn from the MAISY Residential Customer Energy Use Databases. ZIP code area energy cost infmation data are available from the author. Energy costs for 2020 and 2022 are calculated for each of the sample dwelling units using data on energy use (electric, natural gas, fuel oil propane), ZIP-lelvel electric utility prices and state-level fossil prices. August 2022 US Energy Department forecasts of price increases (or reductions in the case of gasoline) were used to compute the full-year 2022 energy costs. Why Such Differences Among States? Electric generation fueled primarily by natural gas boosts electric prices more than generation that relies on coal, nuclear or hydro. Households using more fossil fuels (natural gas, fuel oil and propane) for space heating, water heating, dryers, and ovens experienced steeper price increases than those using predominately electricity. Gasoline prices and commuting distances vary significantly across ZIP codes within states. The bottom line is that variations in energy and commuting cost increases across states reflect variations in electric generation cost increases, household variations in energy use, fuel sources, fossil fuel price increases and variations in commuting patterns and state gasoline cost increases. A Look at ZIP-Level Variations in Energy Cost Inflation 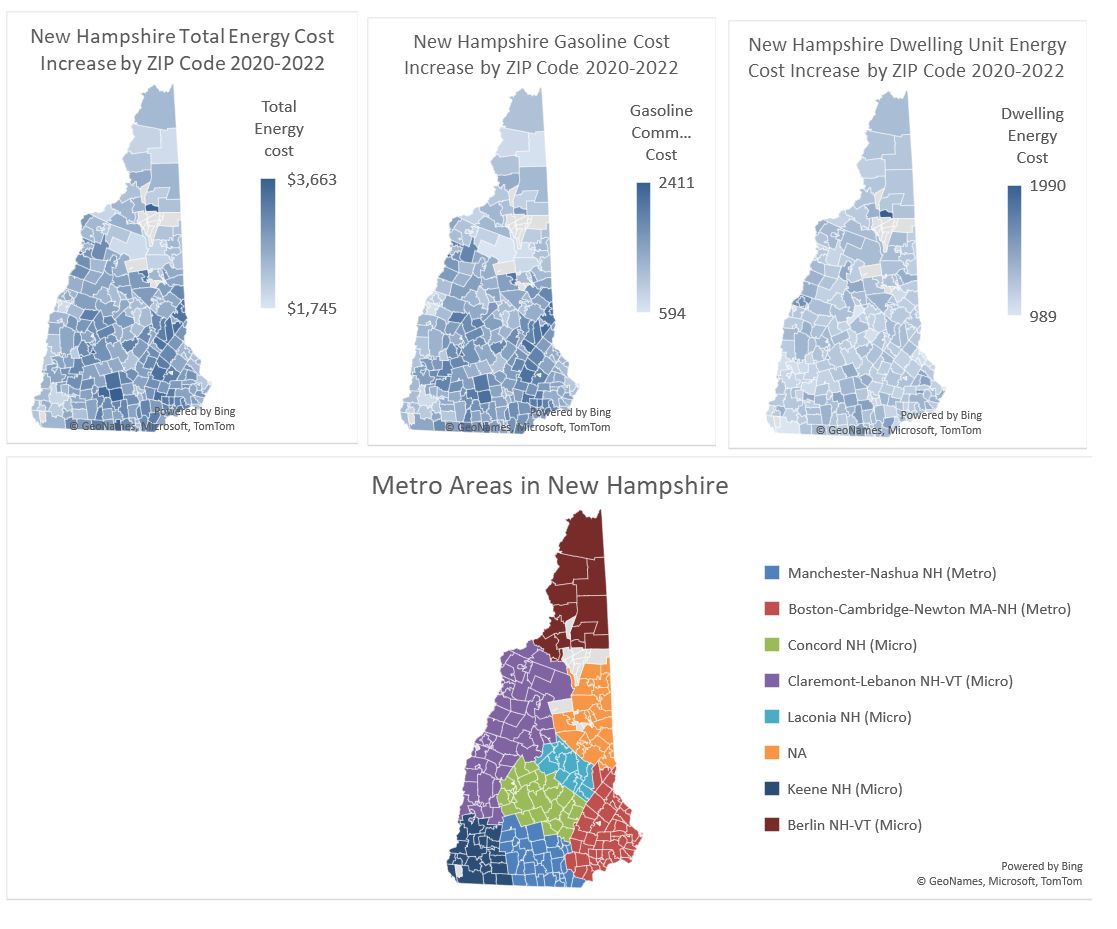
Comparing energy cost increases across states shows a huge variation. That begs the question: how much variation is there across individual ZIP code areas within individual states. How much more inflation pain do homeowners in some ZIP areas face compared to the average in the state. These study results show significant variations in ZIP-level energy cost increases from 2020 to 2022 within individual states. The following graphics show New Hampshire ZIP detail for total dwelling unit and commuting energy cost, as well as costs for each of these categories separately. A heat map of metro areas is also shown to provide a geographic reference to the ZIP-level maps. A visual evaluation of these New Hampshire maps suggests, as one might expect, a mild clustering of gasoline commuting cost increases. Dwelling unit cost increases reflect both dwelling unit size, demographics, choice of fuels and the electric utility provider price; however, some geographic clustering is also apparent. The take-away from this example of ZIP-detailed energy cost inflation is that, even within individual states, the impact of energy cost inflation is unevenly distributed. About the Author Jerry Jackson is a former Signature Professor at Texas A&M University, Chief of the Applied Research Divisions at Georgia Tech Research Institute and economist at Oak Ridge National Laboratory and the Federal Reserve Bank of Chicago. He is also President of Jackson Associates (JA) and the author of MAISY ZIP Level Utility Customer Energy Use Databases. JA MAISY Databases were first introduced in 1995. Annual updates have expanded databases to include data from more than 7 million US utility customer records. JA MAISY data have been used by the US Department of Energy in analysis supporting appliance efficiency standards, by state regulatory agencies from Texas to New York, and by dozens of solar, CHP, battery and other energy equipment manufacturers, utilities and retail electricity providers. Dr. Jackson has provided testimony in a variety of state and provincial hearings as an expert witness. His early modeling work at Oak Ridge National Laboratory provided the basis for energy forecasting at the US Department of Energy and state agencies. Most recently JA provided a 2021 agent-based model forecasting application for five Indiana investor-owned utilities submitted to the Indiana Public Service Commission by the Purdue University State Utility Forecasting Group. He published “Energy Budgets at Risk (EBAR): Risk Management Approach to Energy Purchase and Efficiency (Wiley, April 2008),” the first extension of risk management principles to evaluate building energy efficiency investments. He received a patent in 1995 for a drill-down and data visualization technology that has been licensed by Microsoft, Oracle, SAP and other major business intelligence software providers. He holds a Ph.D. in economics from the University of Florida with specialties in econometrics and regional economics. Click Here for a partial list of JA clients. |
Related Topics |